As center pivot irrigation systems age, a multitude of issues can be found, including leaking joints, clogged sprinklers and missing sprinkler heads, among others. These issues can cause areas of non-uniformity in the system that can make locations under- or over-irrigated, which can increase the potential for nitrogen leaching into groundwater.
Poor uniformity in irrigation can also lead to excess energy use and cost, as well as potentially decreasing yield due to poor soil aeration. In order to improve the uniformity of an irrigation system, an evaluation must be conducted.
The catch can method is simple and effective in evaluating the uniformity of the irrigation system. The procedure includes placing 32-ounce catch cans at 10-feet spacing in a straight line outward from the pivot elbow. Photo 1 shows a demonstration of the catch can test near Three Rivers, Michigan. Once the catch cans are installed in the field, run the irrigation system over the line of cans, then measure the water level in each using a graduated cylinder and record. Make sure to test the uniformity when the wind is calm because the precision of the uniformity testing decreases when wind exceeds 2.2 mph. If wind speed goes beyond 11 mph, the test may not be a valid measure of uniformity.
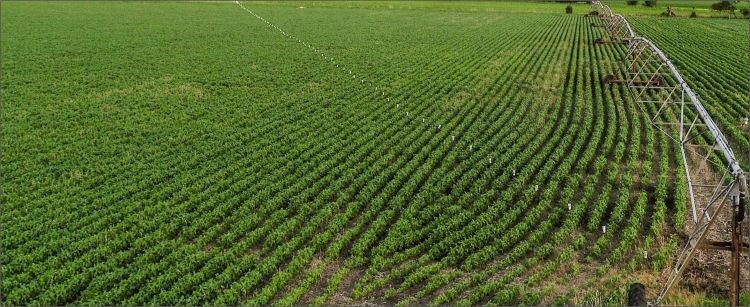
Photo 1. Catch can test demonstration. Photo by Eric Anderson, MSU Extension.
Once the catch can data is collected, you can input those numbers into the Irrigation System Uniformity Spreadsheet to calculate the coefficient of uniformity (CU). More detailed information about using the Irrigation System Uniformity Spreadsheet can be found in Evaluating Irrigation System Uniformity Factsheet.
The CU is a numeric judgment of the overall performance of an irrigation system’s ability to evenly apply water to the field.
- If the CU is 85 percent or greater, the irrigation system is not likely to need major adjustments to the sprinkler package, although individual sections of the irrigator may benefit from corrections.
- A CU of 80 to 85 percent may need further analysis of the sprinkler package, and individual sections of the irrigator would benefit from corrections.
- A CU of less than 80 percent requires an adjustment to the sprinkler package design and correction of individual sections of the sprinkler package.
If the uniformity of your center irrigation system is poor:
- Ensure your irrigation system runs at the correct water pressure.
- Inspect the emitter to see if it is clogged.
- Check for equipment wear.
- Check for leaks.
Photo 2 shows the irrigation system uniformity results from a center pivot irrigation system, evaluated by the Michigan State University Extension irrigation team. This pivot had sprinkler packages that were 8 years old. The team collected catch can test data before and after replacing the sprinkler package. The CU was calculated using the Irrigation System Uniformity Spreadsheet. After replacing the sprinkler package, the CU was increased from 73 to 91.
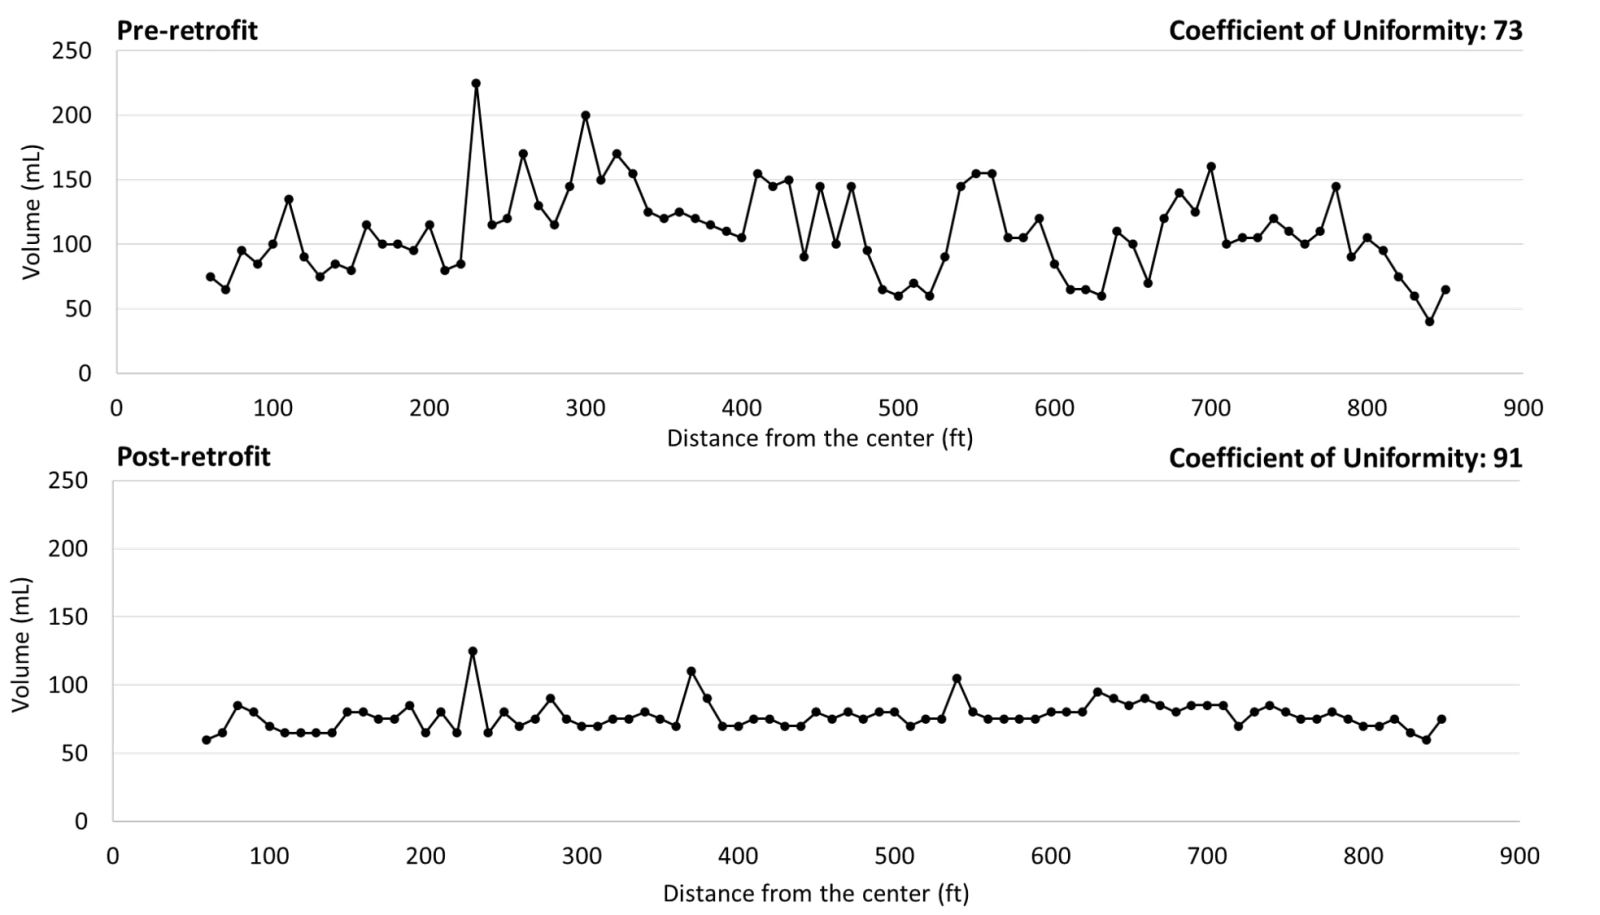
Photo 2. Catch can test results before replacing the sprinkler package (pre-retrofit) and after replacing the sprinkler package (post-retrofit).
The scheduling coefficient (SC) is a run time multiplier that shows the amount of extra water that needs to be applied to get the dry areas of the field wet. After the sprinkler package was replaced, the SC was reduced from 1.4 to 1.2. Below is an example of the potential economic impacts of the improved uniformity.
|
Annual water savings
|
|
Water savings per acre-inch applied from increased uniformity
|
0.2 inches
|
|
Average acre-inches applied (corn and soybean production)
|
6 inches
|
|
Total water savings per acre
|
(0.2 inch x 6 inch) = 1.2 inches
|
|
Annual cost savings
|
|
Average energy cost per acre-inch in Michigan
|
$3.16 - $7.50 per acre-inch
|
|
Example size of field
|
100 acres
|
|
Total energy savings per year
|
($5.33* x 1.2 inches x 100 acres) = $640
|
|
|
|
*Average irrigation energy costs; $3.16-$7.50 per inch per acre.
On average, the material cost of a sprinkler package, excluding the irrigation system cost, is around $3,000. With $640 in energy savings per year, the payback period of updating the sprinkler system is approximately 4.7 years. During that time, the updated irrigation system would also be saving 564 acre-inches of water (15.3 million gallons).
Additionally, the economic impacts will increase if you are chemigating or fertigating (applying chemicals or fertilizer, respectively, through the pivot). Thus, improving irrigation system uniformity is critical to increase irrigation water use efficiency, reduce the energy cost, minimize potential nutrient leaching below the root zone, and maximize farm profits.
More detailed information on the procedure for uniformity evaluation of center pivot/lateral move irrigation machines can be found in ASAE S436.1 Standard (Test Procedure for Determining the Uniformity of Water Distribution of Center Pivot and Lateral Move Irrigation Machines Equipped with Spray or Sprinkler Nozzle).
This on-farm irrigation system uniformity evaluation and retrofit is supported by Project GREEEN.
For more information, visit https://extension.msu.edu.