This article appears in the September 2017 issue of Potato Grower.
Sure, you know for the most part what happens with your potatoes once they’ve left your place. But what about all those other potatoes grown all over the country? How are people buying and eating these wonderful vegetables that come out of the ground? Potatoes USA has run the numbers, and we have them here for you.
According to Potatoes USA statistics, reported in the organization’s “2016 U.S. Potato Sales & Utilization” report, the foodservice sector soaked up some 20.389 billion pounds fresh weight equivalent (FWE) of U.S. potato sales in 2016, for a 58 percent share. The retail market utilized the remaining 42 percent (14.524 billion pounds FWE). Below is a breakdown of how those potatoes showed up on store shelves and plates at restaurants.
For more information, visit growers.potatoesusa.com/research.
- Frozen

42 percent
15.045 billion pounds FWE
- Fresh
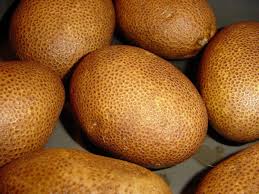
26 percent
9.393 billion pounds FWE
- Chips

21 percent
7.729 billion pounds FWE
- Dehydrated Products
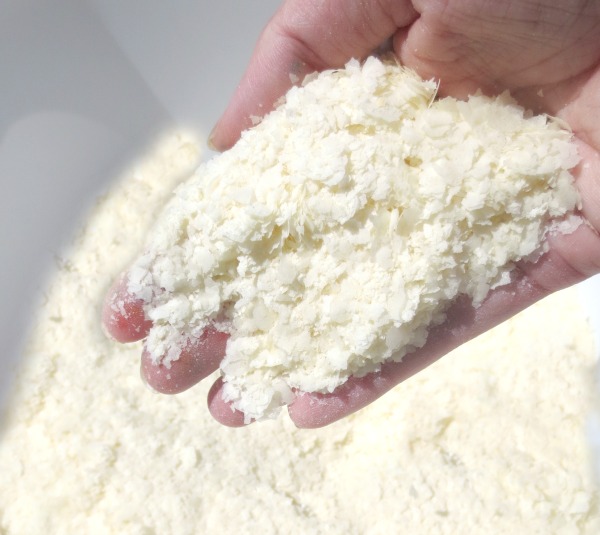
8 percent
2.988 billion pounds FWE
- Refrigerated Products

3 percent
1.141 billion pounds FWE