The following summaries are the Nielsen Scantrack segment reports for Supermarkets ONLY for Q3 (July-Sept) 2011 Fresh UPC products, Chips, Dehy, Frozen and Refrigerated potatoes.
 Summaries
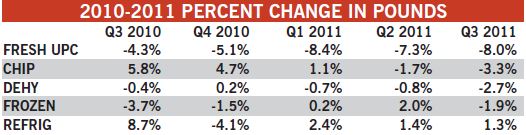
In Q3 2011, all forms of potatoes increased pricing, with fresh leading the pack at 22.5 percent. While volume sales in fresh lagged, dollars increased 12.7 percent because of the large price increase. Behind fresh, chips registered the second-largest price increase at 5.9 percent. Refrigerated potatoes had the third-largest increase in price, but it was the only form where the price did not inhibit volume sales, which grew 1.3 percent. Dehydrated potato dollar and volume decreased 1.2 percent and 1.1 percent compared to a year ago. Frozen potatoes remained relatively steady, increasing pricing 3.7 percent and dollars 1.8 percent.
When comparing the whole 52-week period ending September 24, 2011, to the previous year, fluctuations were not as dramatic; however, refrigerated was still the only form to increase volume sales. Refrigerated was also the only form where the rate of price growth slowed down in Q3 2011 compared to the 52-week period.
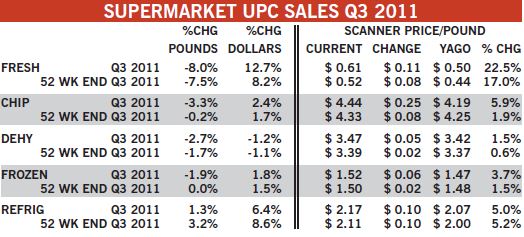
Fresh Bagged
Price increases dictated the performance in fresh potatoes. Q3 2011's average price-per-pound was 22.5 percent higher than the previous year. As a result, pounds sold dropped -8.0 percent in Q3, which is slightly more than the 52-week period as a whole. Not all fresh potatoes had volume losses. Organic potatoes increased almost 50 percent in Q3 2011 versus a year ago, and potatoes sold in packages weighing less than four pounds increased more than 11 percent. It seems consumers are moving away from the "stock-up" pack sizes. Sixteen- to 50-pound bags sold only two-thirds of its Q3 2010 sales, which was the largest volume drop in fresh potatoes.
Chips
In Q3 2011, the price of chips averaged $0.25 higher than Q3 2011, an increase of 5.9 percent and $0.11 higher than the 52-week average price. Pounds decreased slightly in Q3, but dollars were up because of the price increase. Volume and dollar sales were down the most in the West South Central sub-region, decreasing pounds over 10 percent in Q3 2011 compared to the previous year. The Mountain sub-region had the smallest increase in price per pound and was one of the only sub-regions to increase volume sold.
Dehydrated
Sales of dehydrated potatoes were down in Q3 2011 compared to the previous year. Dollar sales were down, despite increased average price per pound. Price increases were not uniform across regions; average price per pound in Q3 2011 was 3.8 percent lower in the Mountain sub-region, compared to the previous year. This, unfortunately, did not spur volume growth; the Mountain sub-region also had the largest decrease in dollar sales (11.0 percent).
Frozen
Sales of frozen potatoes were steady when looking at the 52-week period ending Q3 2011, compared to the previous year. A slight increase in price per pound resulted in a slight increase in dollar sales for the year. However, Q3 on its own had a small decrease in pounds from the prior year. At -5.0 percent, the West North Central sub-region had the largest decrease in pounds, while the Mountain sub-region increased pounds by 2.0 percent.
Refrigerated
Refrigerated potatoes increased dollars and volume compared to a year ago, with Q3 2011 increasing at a slower rate than the 52-week period as a whole. Refrigerated mashed potatoes had a slight increase in pounds sold, but the other forms of refrigerated potatoes performed better. However, the West North Central sub-region decreased pounds sold in Q3 by 11.8 percent. Dollar sales in this sub-region remained steady because of the 14.4 percent increase in average price per pound. The Mountain sub-region increased dollar sales more than 10 percent in Q3 compared to the prior year.